 Tendrl
Docs / Contact / dashboards/building-dashboards
Building Dashboards
This walkthrough assumes you have a service with an entity assigned to it that has published at least a few messages. Validation rules make the builder smarter (a field with a between rule gets an expected-range band; a field with an in rule gets severity colors), but they are not required: the builder also lists every field your devices have actually sent.
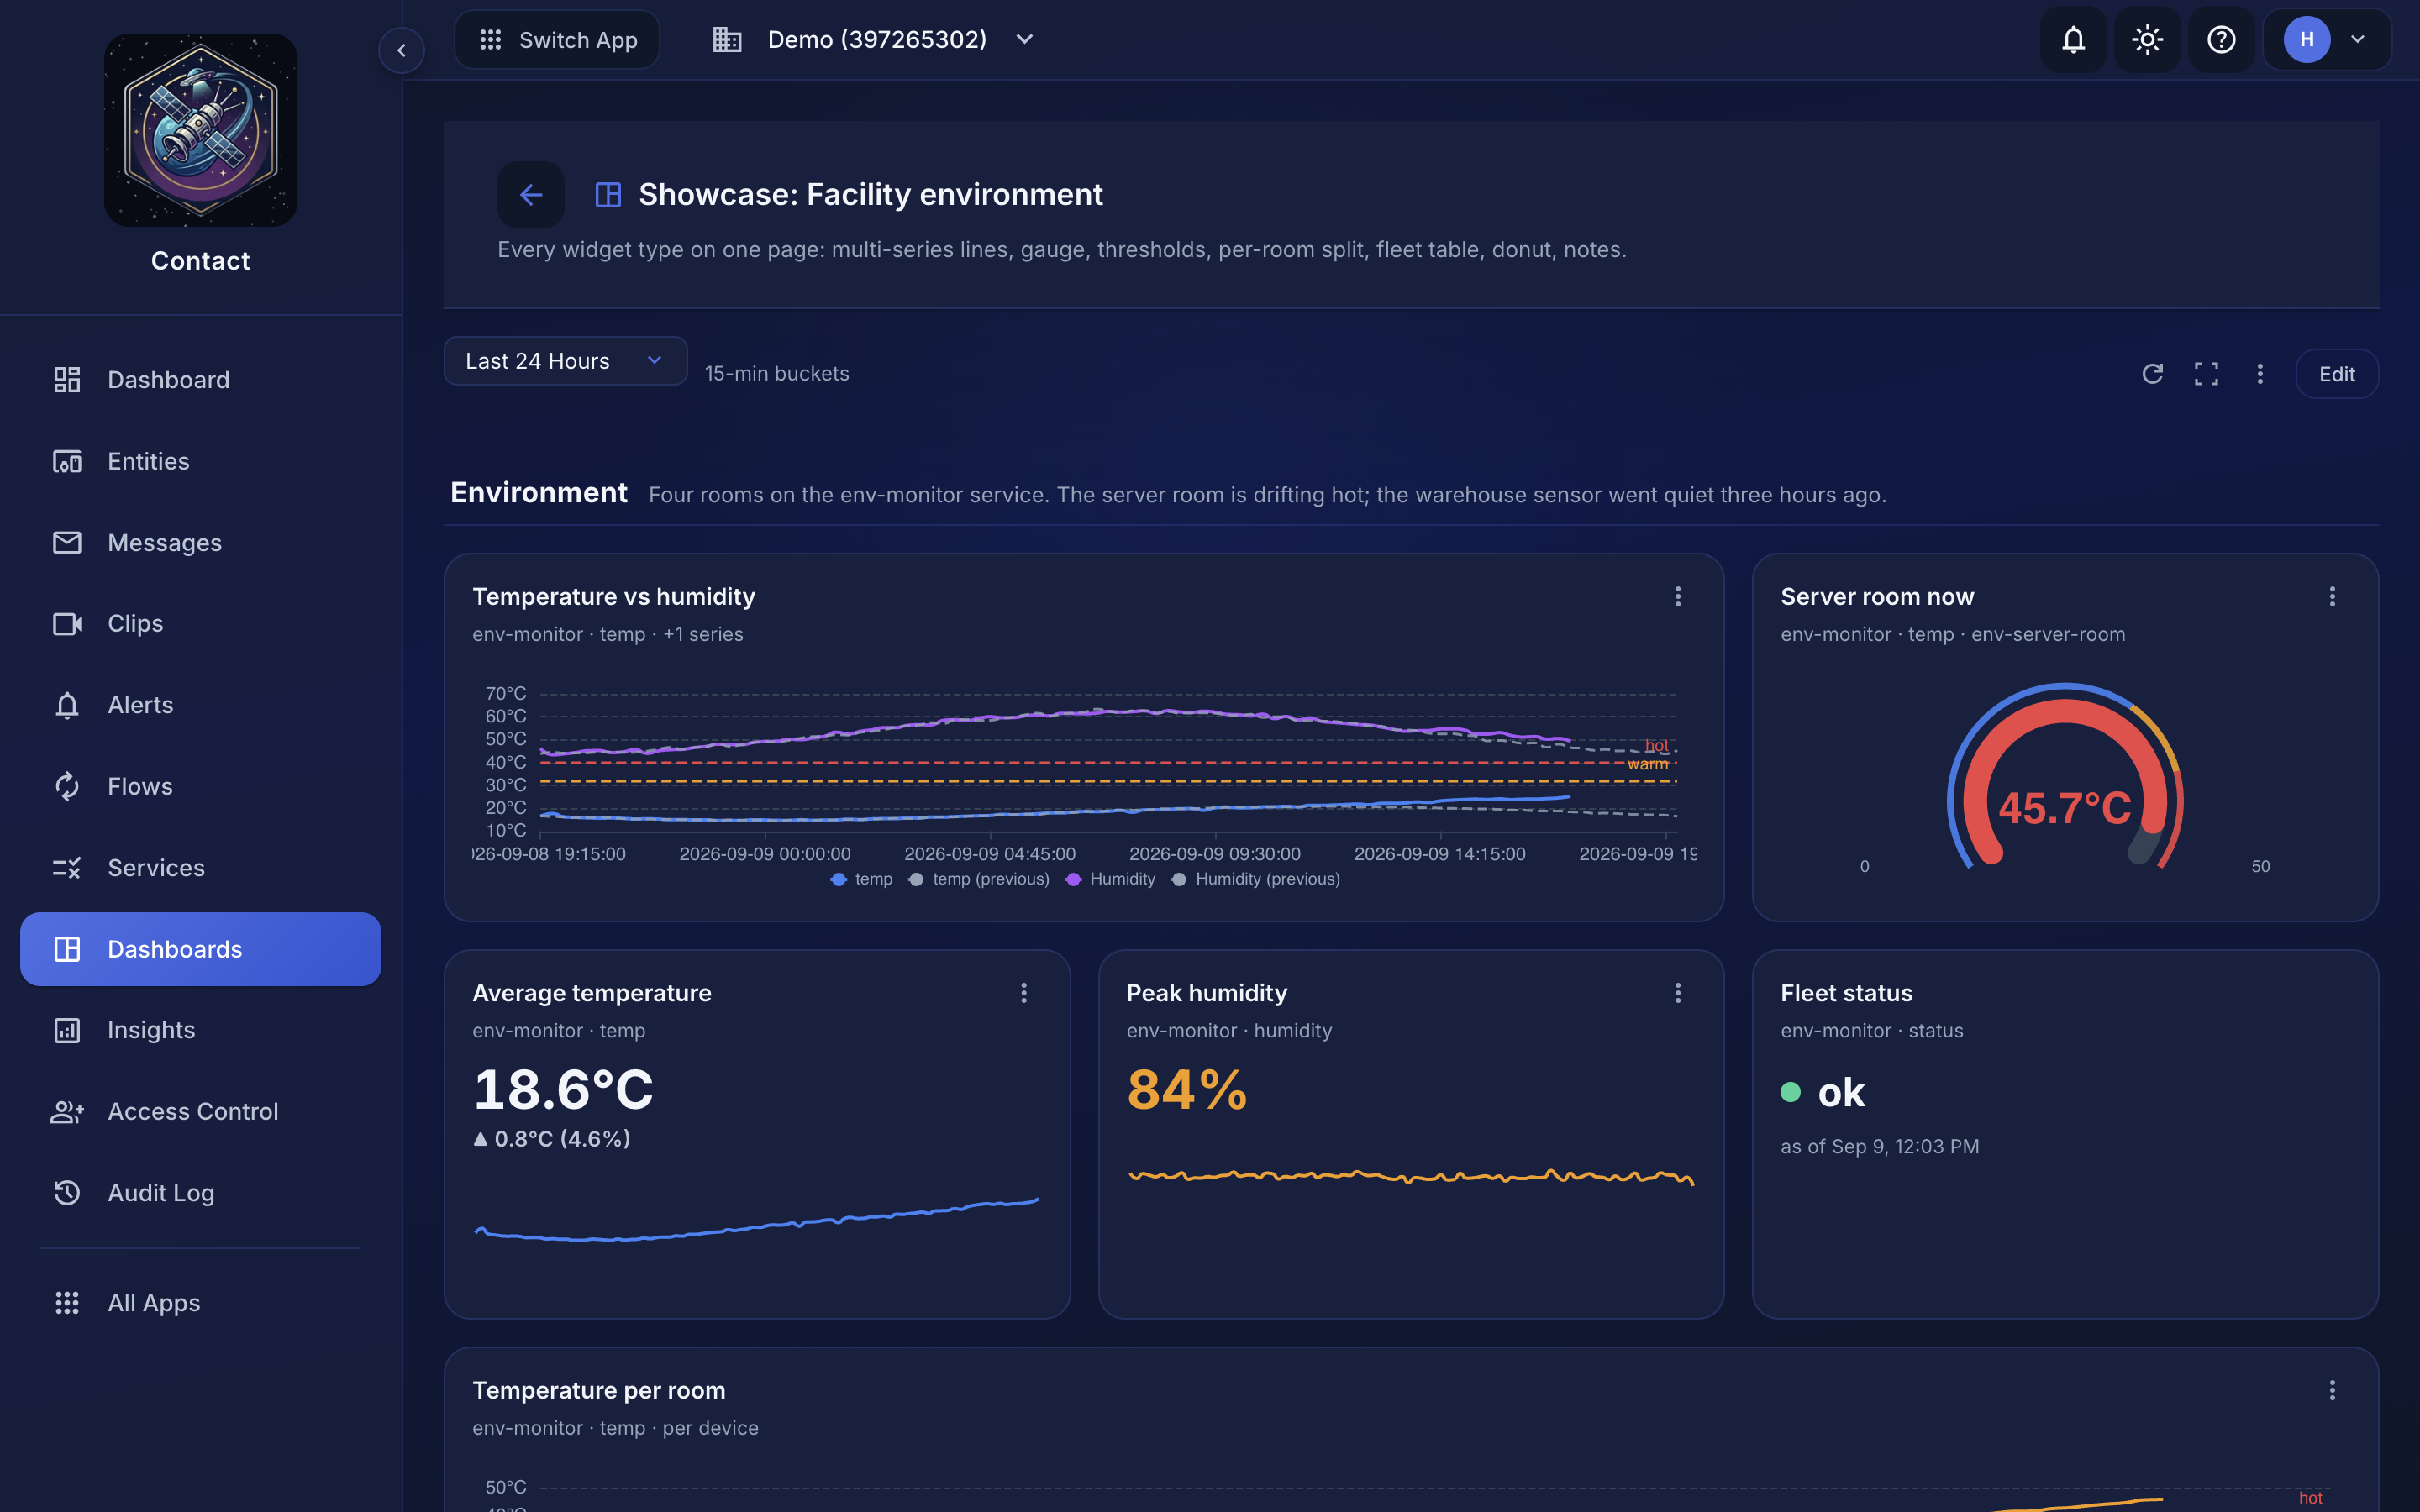
Create a dashboard#
- Navigate to Dashboards
- Click New dashboard
- Name it, optionally pick Start from a service to generate a starter set of widgets for every field that service declares or its devices publish, and save
Start from a service only appears once the account has at least one service. Before that the dialog asks for a name and description alone, and you build the dashboard by adding widgets. You can generate a starter set later from the … menu.
You can rename a dashboard later from its menu.
Add a widget#
Open the dashboard, click Edit, then Add widget. The editor has a Data tab, a Display tab, and a live preview on the right that renders exactly what the card will show.
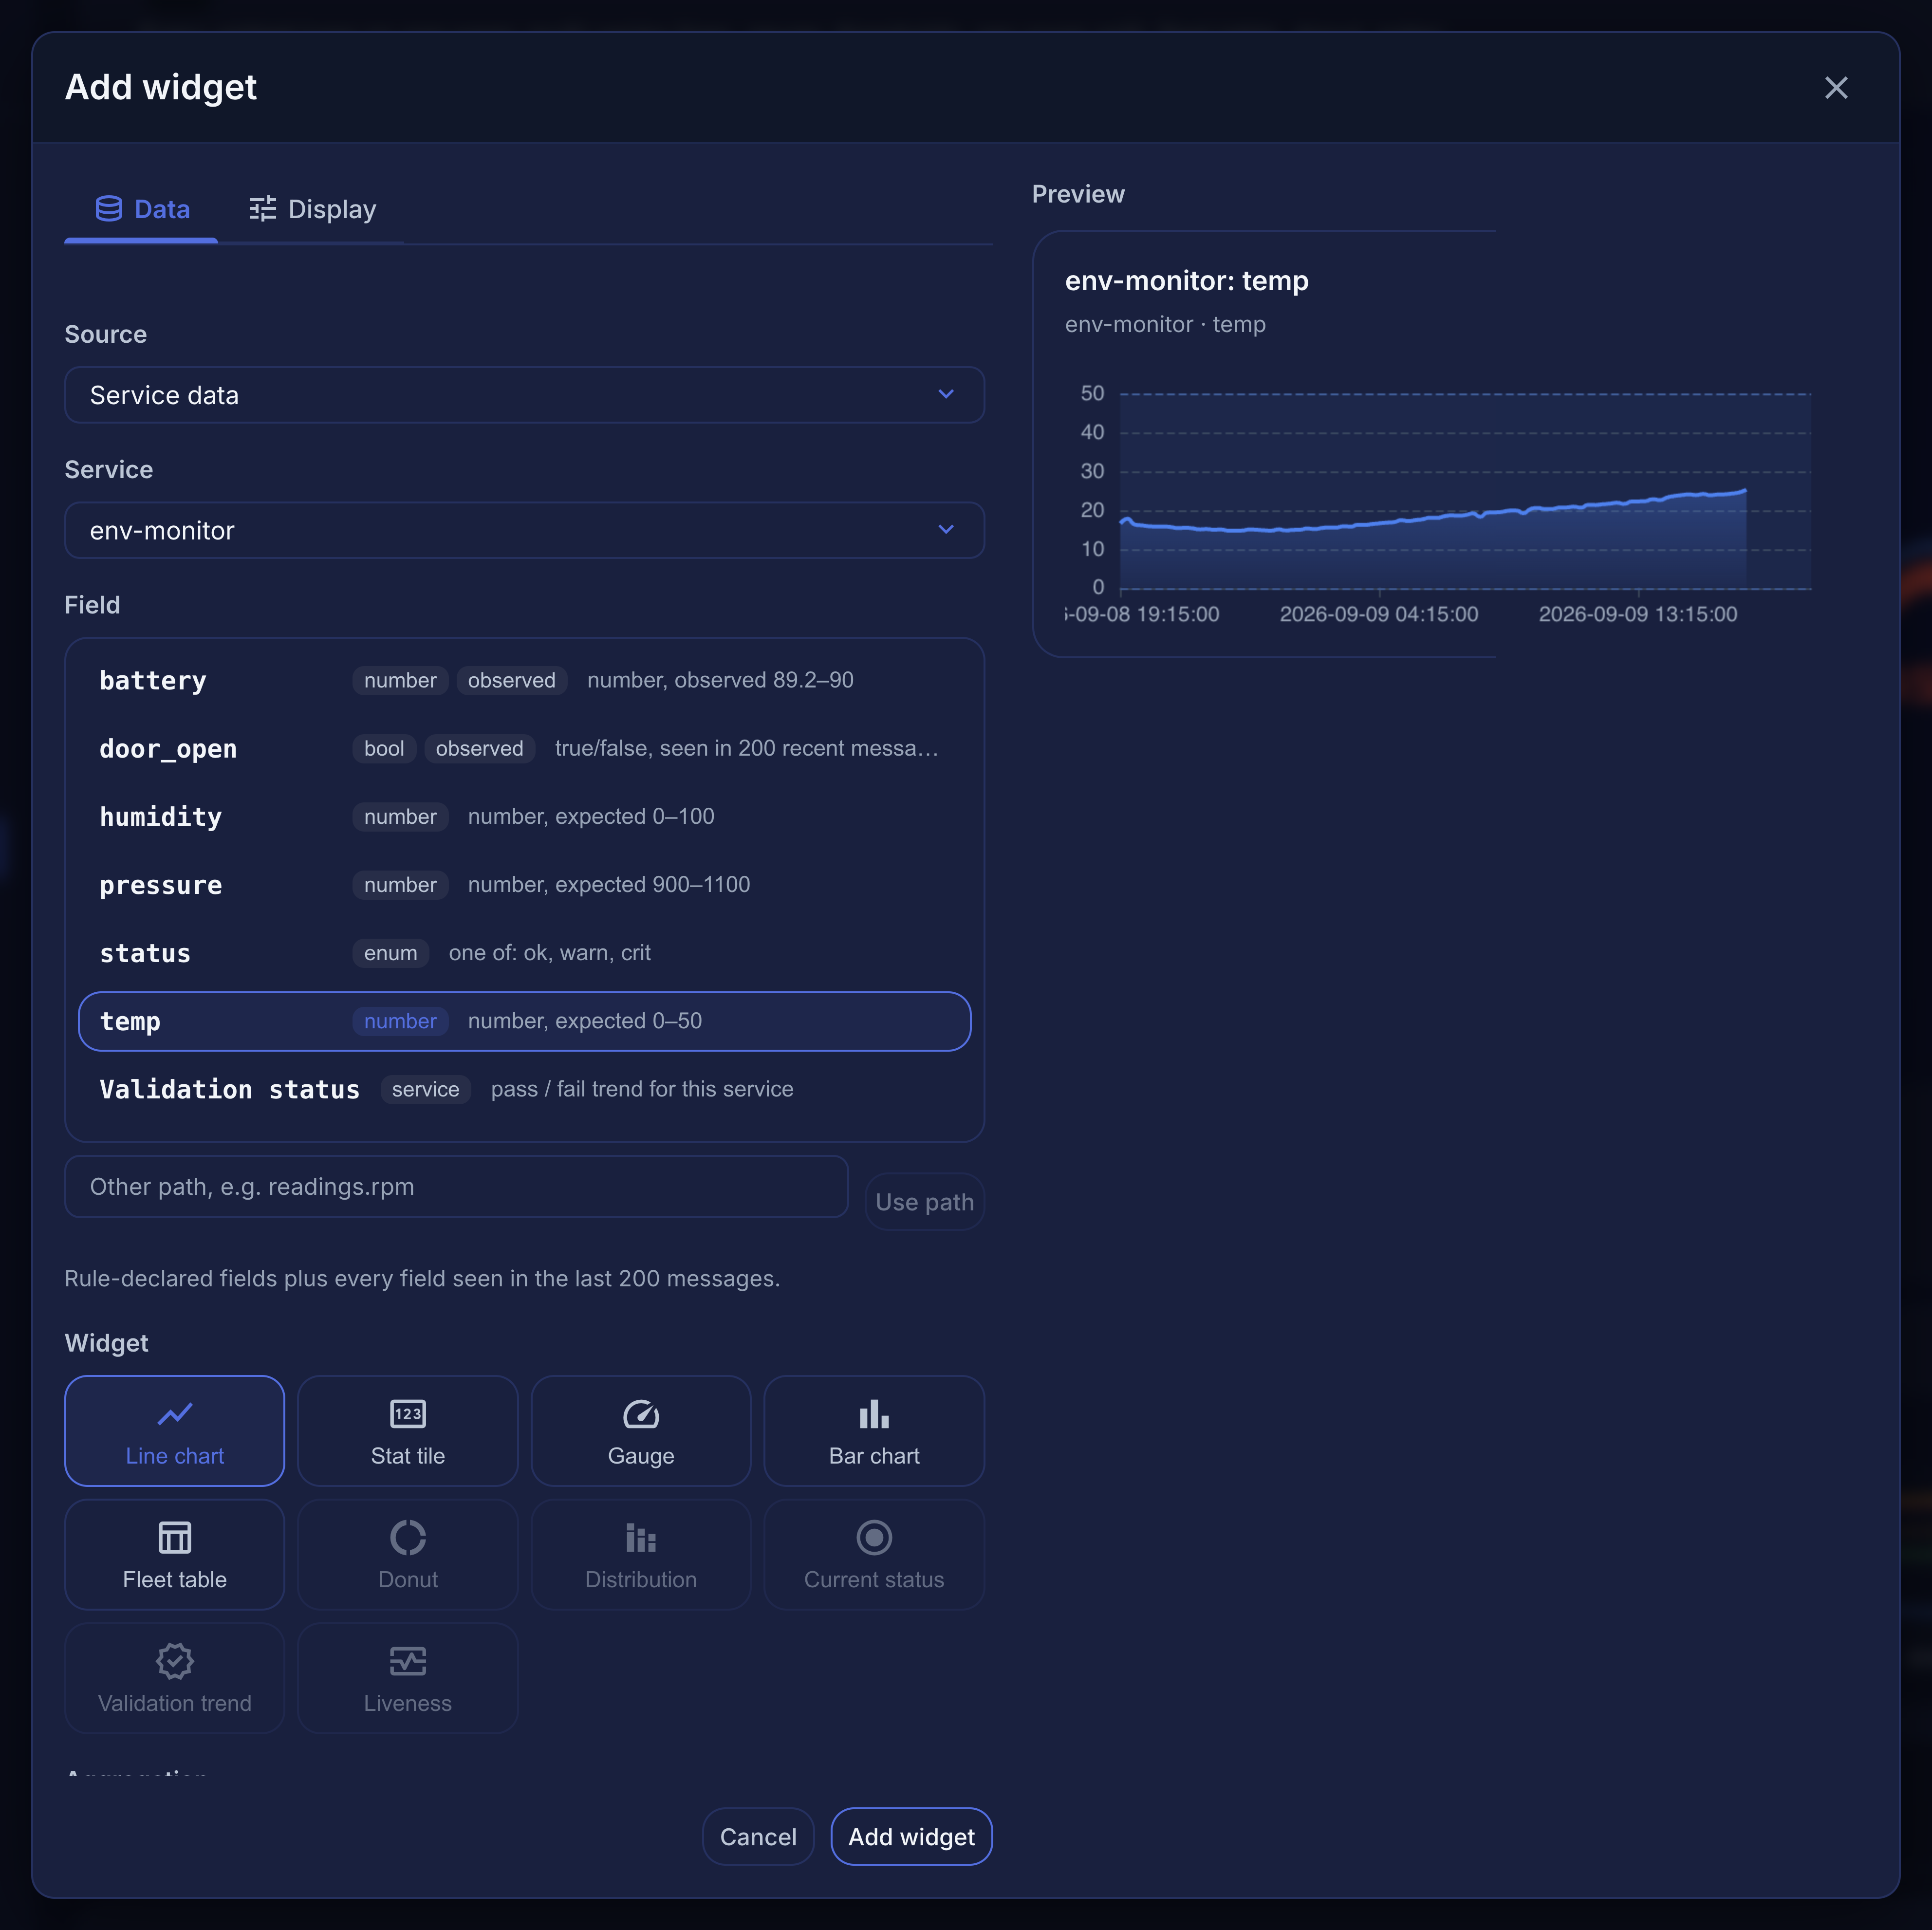 Fields marked "observed" came from recent messages rather than a validation rule. The preview runs the same query the dashboard will.
Data#
Source
Service data for anything your devices publish, Device health (heartbeat) for memory/disk charts of a single device, or Text or section header for notes and labels.
Service
pick the service whose data you want.
Field
the list combines what the service's rules declare with what its devices have published recently (marked observed). Each entry says what is known about it, for example number, expected 0–50 or number, observed 18.2–24.9. You can also type any other path, such as readings.rpm, and use it directly. Two service-level entries, Validation status and Message volume / liveness, are always available.
Widget
the types that fit the field's shape are shown first; the rest are dimmed but still selectable.
Aggregation
how values inside each time bucket combine. Numbers offer average, minimum, maximum, sum, median, 95th percentile, standard deviation, last value, and message count.
Devices
all devices on the service, one specific device, or a dashboard selector (see below). Line and bar charts can also draw one series per device.
- More series (line, bar, table): overlay another field, or the same field for a specific device, each with its own label and color. For a table, each series is a column.
- Title (optional): auto-generated from the binding if left blank.
Display#
- Unit and decimals apply everywhere the value appears: axis, tooltip, tile, table cell.
- Thresholds color a value from each threshold upward (good, warning, bad, or a custom color). They override the rule-range coloring.
- Axis min/max pin the axis, or the gauge scale.
- Style: line, line with fill, or bars; bars can be stacked or grouped.
- Time bucket: Auto keeps a chart under about 200 points; pin a bucket when you need a specific resolution.
- Time range: follow the dashboard, or fix this widget to its own window.
- Compare: also show the previous period of the same length as a dashed line, or as a delta on stat tiles.
- Width (1 to 6 columns) and height (normal, tall, extra tall).
Widget types#
| Widget | Best for | Shows |
|---|---|---|
| Line chart | numeric fields | bucketed values over time, one or more series, with the rule's expected range as a shaded band |
| Bar chart | numeric fields, message volume | bucketed bars, stacked or grouped |
| Stat tile | any field | one number for the range with unit, thresholds, change versus the previous period, and a sparkline |
| Gauge | numeric fields | the latest value on a min/max arc, painted by thresholds |
| Fleet table | any fields | the newest value per device, one column per field, sortable, with how long ago each device reported |
| Donut | enum/text fields | share of each value over the range |
| Distribution | enum/text fields | counts of each value per bucket |
| Current status | enum fields | the newest raw value, colored by its position in the declared value set |
| Validation health | whole service | pass/fail trend and overall success rate |
| Liveness | whole service | time since the last publish, over a message-volume trend |
| Device health | one device | memory and disk percentage over time, from heartbeats |
| Text | notes | a note with bold, code, links and bullets |
| Section header | layout | a full-width label that groups the widgets below it |
One dashboard for the whole fleet#
Open Settings (from the dashboard menu, or the … menu in edit mode) and add a device selector. A dropdown then appears in the toolbar. Any widget whose Devices setting is that selector follows it, so the same dashboard shows whichever device you pick; leaving the selector empty shows all devices.
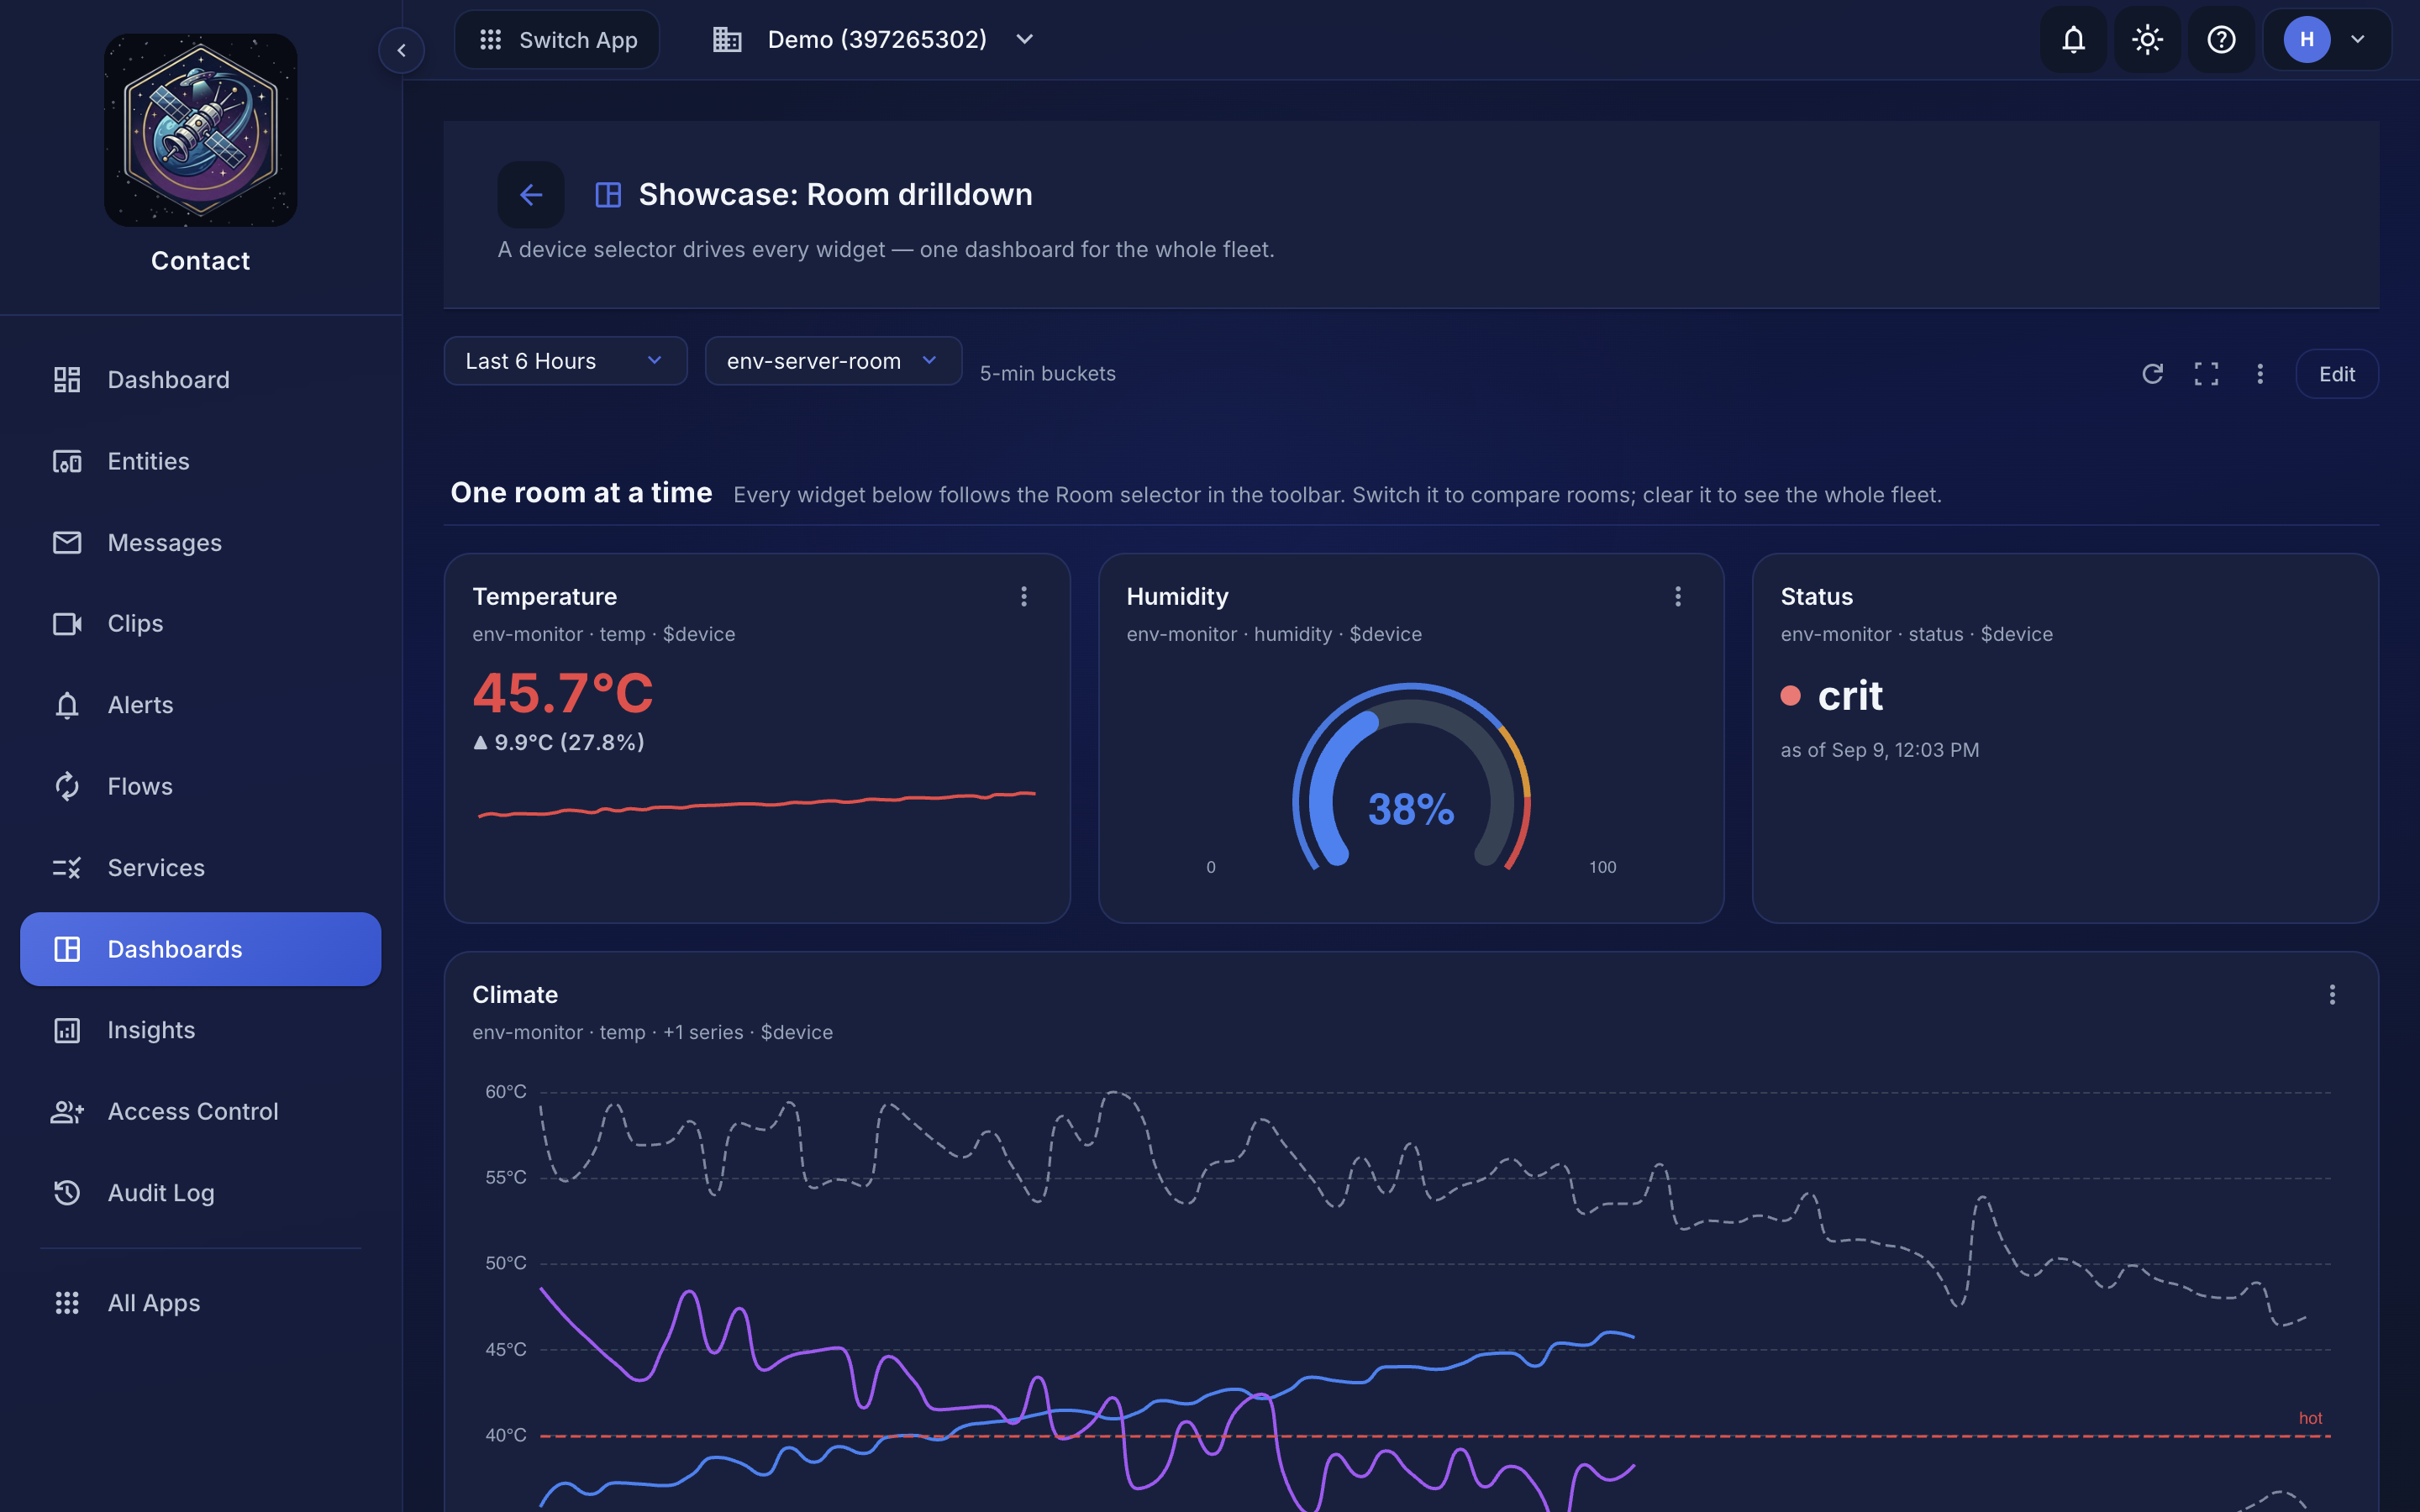 The selector defaults to the room named in Settings. The stat tile's arrow is the change versus the previous six hours.
Arrange the layout#
In edit mode:
- Drag a widget card onto another to reorder (or use the arrow buttons).
- The width button cycles a widget through 2, 3, 4 and 6 columns; the height button through three heights. The editor's Display tab sets both precisely.
- Duplicate a widget to reuse its settings for another field.
- Add a section header or text block from the … menu, or generate widgets from a service to append a starter set.
- Save persists the whole layout; Cancel discards every edit at once.
Reading the data#
- The time-range picker applies to the whole dashboard, and only offers ranges inside your plan's retention window. If a saved range exceeds it, the dashboard notes that it clamped.
- Custom range… opens a start and end picker for an exact window. A custom window is a snapshot and does not auto-refresh.
- Data refreshes every 30 seconds while the tab is visible; change the interval in Settings.
- The toolbar shows which bucket auto-bucketing chose, so you know whether a point is a minute or a day.
- Full screen hides the app around the dashboard for a wall display. Press Escape to exit.
- Each widget's ⋮ menu downloads the chart as a PNG or its data as CSV.
- A numeric widget shows a gap where a device sent something that isn't a number; a gap is information (bad data arrived), not an error. Numeric strings like
"21.5"chart normally, andtrue/falsechart as 1 and 0. - A distribution can include values the service never declared (a device sending
"meltdown"when the rule saysok | warn | crit). That mismatch is worth investigating, and the validation-health widget will show the failures.
Limits#
- Up to 24 widgets per dashboard, 8 series per widget, 4 device selectors. Dashboards per account scale with your plan: 3 on Free, 5 on Starter, 20 on Standard, 50 on Pro.
- Dashboards chart
publishmessages; only messages from entities assigned to the bound service appear. - "One series per device" draws the 12 busiest devices and says how many were left out.
- A pinned time bucket that would produce more than 2,000 points is refused for that widget; pick a coarser bucket or a shorter range.
